 Follow Us on Google News
 Follow Us on Google Discover
The National Institute for Communicable Diseases (NICD), a division of the National Health Laboratory Service, continues the monitoring and surveillance of COVID-19 in order to inform the public health response.
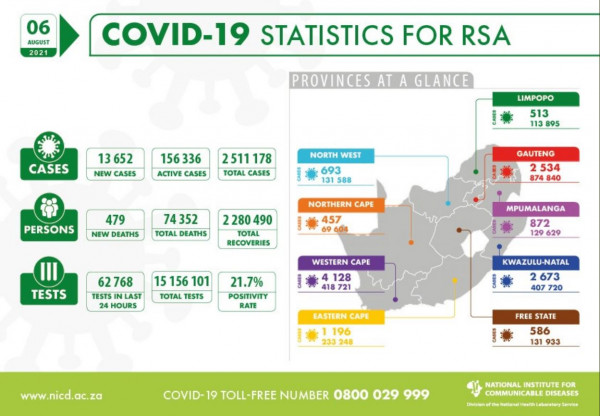
Today the institute reports 13 652 new COVID-19 cases that have been identified in South Africa, which brings the total number of laboratory-confirmed cases to 2 511 178. This increase represents a 21.7% positivity rate.
As per the National Department of Health, a further 479 COVID-19 related deaths have been reported, bringing total fatalities to 74 352 to date.
15 156 101 tests have been conducted in both public and private sectors as per the table below.
|
Sector |
Total tested |
New tested |
||
|
PRIVATE |
8 414 774 |
56% |
28 563 |
46% |
|
PUBLIC |
6 741 327 |
44% |
34 205 |
54% |
|
Total |
15 156 101 |
62 768 |
||
The cumulative number of cases by province is shown in the table below:
PROVINCIAL BREAKDOWN
The majority of new cases today are from Western Cape (30%), followed by KwaZulu-Natal (20%) Gauteng accounted for 19%; Eastern Cape accounted for 9%; Mpumalanga accounted for 6%; North West accounted for 5%; Free State & Limpopo each accounted for 4% respectively; and Northern Cape accounted for 3% of today’s new cases.
|
Province |
Total cases for 05 August 2021 |
Adjusted numbers after harmonisation |
Updated total cases on 05 August 2021 |
New cases on 06 August 2021 |
Total cases for 06 August 2021 |
Percentage total |
|
Eastern Cape |
232 064 |
-12 |
232 052 |
1 196 |
233 248 |
9.3 |
|
Free State |
131 352 |
-5 |
131 347 |
586 |
131 933 |
5.3 |
|
Gauteng |
872 370 |
-64 |
872 306 |
2 534 |
874 840 |
34.8 |
|
KwaZulu-Natal |
405 077 |
-30 |
405 047 |
2 673 |
407 720 |
16.2 |
|
Limpopo |
113 385 |
-3 |
113 382 |
513 |
113 895 |
4.5 |
|
Mpumalanga |
128 754 |
3 |
128 757 |
872 |
129 629 |
5.2 |
|
North West |
130 880 |
15 |
130 895 |
693 |
131 588 |
5.2 |
|
Northern Cape |
69 152 |
-5 |
69 147 |
457 |
69 604 |
2.8 |
|
Western Cape |
414 621 |
-28 |
414 593 |
4 128 |
418 721 |
16.7 |
|
Total |
2 497 655 |
-129 |
2 497 526 |
13 652 |
2 511 178 |
100.0 |
7-day moving average number of new cases by province and date of reporting, 12 April 2020 to date, South Africa.THE 7-DAY MOVING AVERAGE NUMBER OF NEW CASES BY PROVINCE
The total number of cases today (n=13 652) is lower than yesterday (n=13 777) and higher than the average number of new cases per day over the 7 preceding days (n=10 939)
The 7-day moving average daily number of cases has increased
For more detailed information, visit the GIS Dashboard.
HOSPITAL ADMISSIONS
There has been an increase of 566 hospital admissions in the past 24 hours. The following table is a summary of reported COVID-19 admissions by sector.
|
Sector |
Facilities Reporting |
Admissions to Date |
Died to Date |
Currently Admitted |
|
Private |
257 |
178 717 |
32 088 |
7 611 |
|
Public |
411 |
196 082 |
47 369 |
7 698 |
|
TOTAL |
668 |
374 799 |
79 457 |
15 309 |
VACCINE UPDATE
For updates on the national vaccine programme, click here.
Distributed by APO Group on behalf of National Institute for Communicable Diseases, South Africa (NICD).