 Follow Us on Google News
 Follow Us on Google Discover
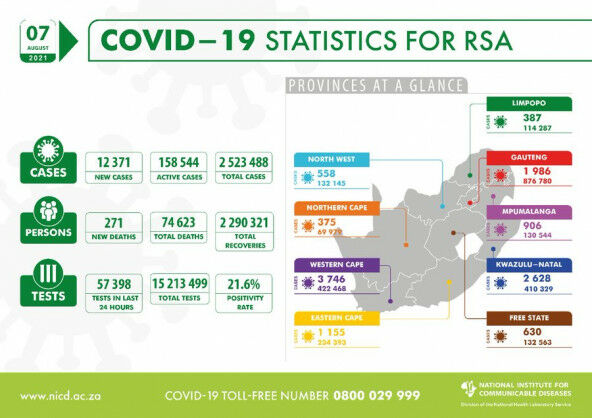

The National Institute for Communicable Diseases (NICD), a division of the National Health Laboratory Service, continues the monitoring and surveillance of COVID-19 in order to inform the public health response.
Today, the institute reports 12 371 new COVID-19 cases that have been identified in South Africa, which brings the total number of laboratory-confirmed cases to 2 523 488. This increase represents a 21.6% positivity rate.
As per the National Department of Health, a further 271 COVID-19 related deaths have been reported, bringing total fatalities to 74 623 to date.
15 213 499 tests have been conducted in both public and private sectors as per the table below.
|
Sector |
Total tested |
New tested |
||
|
PRIVATE |
8 441 048 |
55% |
26 274 |
46% |
|
PUBLIC |
6 772 451 |
45% |
31 124 |
54% |
|
Total |
15 213 499 |
57 398 |
||
PROVINCIAL BREAKDOWN
The majority of new cases today are from Western Cape (30%), followed by KwaZulu-Natal (21%); Gauteng accounted for 16%; Eastern Cape accounted for 9%; Mpumalanga accounted for 7%; North West & Free State each accounted for 5% respectively, and Limpopo & Northern Cape each accounted for 3% respectively of today’s new cases.
The cumulative number of cases by province is shown in the table below:
|
Province |
Total cases for 06 August 2021 |
Adjusted numbers after harmonisation |
Updated total cases on 06 August 2021 |
New cases on 07 August 2021 |
Total cases for 07 August 2021 |
Percentage total |
|
Eastern Cape |
233 248 |
-10 |
233 238 |
1 155 |
234 393 |
9.3 |
|
Free State |
131 933 |
0 |
131 933 |
630 |
132 563 |
5.3 |
|
Gauteng |
874 840 |
-46 |
874 794 |
1 986 |
876 780 |
34.7 |
|
KwaZulu-Natal |
407 720 |
-19 |
407 701 |
2 628 |
410 329 |
16.3 |
|
Limpopo |
113 895 |
5 |
113 900 |
387 |
114 287 |
4.5 |
|
Mpumalanga |
129 629 |
9 |
129 638 |
906 |
130 544 |
5.2 |
|
North West |
131 588 |
-1 |
131 587 |
558 |
132 145 |
5.2 |
|
Northern Cape |
69 604 |
0 |
69 604 |
375 |
69 979 |
2.8 |
|
Western Cape |
418 721 |
1 |
418 722 |
3 746 |
422 468 |
16.7 |
|
Total |
251 1178 |
-61 |
2 511 117 |
12 371 |
2 523 488 |
100.0 |
THE 7-DAY MOVING AVERAGE NUMBER OF NEW CASES BY PROVINCE
The total number of cases today (n=12 371) is lower than yesterday (n=13 652) and higher than the average number of new cases per day over the 7 preceding days (n=10 917)
The 7-day moving average daily number of cases has decreased
7-day moving average number of new cases by province and date of reporting, 12 April 2020 to date, South Africa.
For more detailed information, visit the GIS Dashboard.
HOSPITAL ADMISSIONS
There has been an increase of 371 hospital admissions in the past 24 hours. The following table is a summary of reported COVID-19 admissions by sector.
|
Sector |
Facilities Reporting |
Admissions to Date |
Died to Date |
Currently Admitted |
|
Private |
257 |
179 096 |
32 199 |
7 439 |
|
Public |
411 |
196 733 |
47 554 |
7 497 |
|
TOTAL |
668 |
375 829 |
79 753 |
14 936 |
VACCINE UPDATE
For updates on the national vaccine programme, click here.
Distributed by APO Group on behalf of National Institute for Communicable Diseases, South Africa (NICD).