 Follow Us on Google News
 Follow Us on Google Discover
The National Institute for Communicable Diseases (NICD), a division of the National Health Laboratory Service, continues the monitoring and surveillance of COVID-19 in order to inform the public health response.
Today the institute reports 15 939 new COVID-19 cases that have been identified in South Africa, which brings the total number of laboratory-confirmed cases to 2 269 179. This increase represents a 29.5% positivity rate.
As per the National Department of Health, a further 413 COVID-19 related deaths have been reported, bringing total fatalities to 66 385 to date.
14 154 725 tests have been conducted in both public and private sectors as per the table below.
|
Sector |
Total tested |
New tested |
||
|
Private |
7 939 684 |
56% |
24 675 |
46% |
|
Public |
6 215 041 |
44% |
29 422 |
54% |
|
Total |
14 154 725 |
54 097 |
||
PROVINCIAL BREAKDOWN
The majority of new cases today are from Gauteng (38%), followed by Western Cape (19%). Limpopo accounted for 12%; Mpumalanga accounted for 9%; North West accounted for 8%; Eastern Cape accounted for 5%; KwaZulu-Natal accounted for 4%; Free State accounted for 3%; and Northern Cape accounted for 2% of today’s new cases.
The cumulative number of cases by province is shown in the table below:
|
Province |
Total cases for 15 July 2021 |
Adjusted numbers after harmonisation |
Updated total cases on 15 July 2021 |
New cases on 16 July 2021 |
Total cases for 16 July 2021 |
Percentage total |
|
Eastern Cape |
216 502 |
3 |
216 505 |
826 |
217 331 |
9.6 |
|
Free State |
121 896 |
1 |
121 897 |
520 |
122 417 |
5.4 |
|
Gauteng |
799 454 |
11 |
799 465 |
6 013 |
805 478 |
35.5 |
|
KwaZulu-Natal |
373 285 |
-22 |
373 263 |
611 |
373 874 |
16.5 |
|
Limpopo |
97 588 |
3 |
97 591 |
1 928 |
99 519 |
4.4 |
|
Mpumalanga |
110 378 |
3 |
110 381 |
1 471 |
111 852 |
4.9 |
|
North West |
114 479 |
2 |
114 481 |
1 197 |
115 678 |
5.1 |
|
Northern Cape |
62 633 |
-2 |
62 631 |
368 |
62 999 |
2.8 |
|
Western Cape |
357 025 |
1 |
357 026 |
3 005 |
360 031 |
15.9 |
|
Total |
2 253 240 |
0 |
2 253 240 |
15 939 |
2 269 179 |
100.0 |
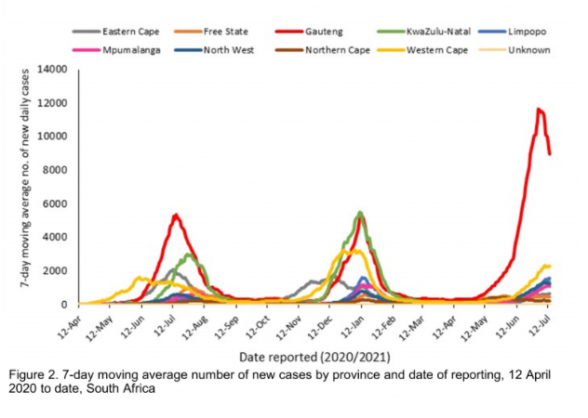
THE 7-DAY MOVING AVERAGE NUMBER OF NEW CASES BY PROVINCE
The total number of cases today (n= 15 939) is lower than yesterday (n= 16 435) but higher than the average number of new cases per day over the 7 preceding days (n=15 928). The 7-day moving average daily number of cases has decreased.
For more detailed information, visit the GIS Dashboard. (https://bit.ly/3xPjhJo)
HOSPITAL ADMISSIONS
There has been an increase of 714 hospital admissions in the past 24 hours. The following table is a summary of reported COVID-19 admissions by sector.
|
Sector |
Facilities Reporting |
Admissions to Date |
Died to Date |
Currently Admitted |
|
Private |
257 |
162 548 |
27 948 |
9 890 |
|
Public |
409 |
174 803 |
41 372 |
7 180 |
|
TOTAL |
666 |
337 351 |
69 320 |
17 070 |
VACCINE UPDATE
For updates on the national vaccine programme, click here. (https://bit.ly/3esSwT9)
Distributed by APO Group on behalf of National Institute for Communicable Diseases, South Africa (NICD).